
May 2025 Calgary Real Estate Market Summary – City, Towns & Counties
Source: CREB Regional Monthly Stats Package (PDF)
City of Calgary
| Metric | Value |
|---|---|
| Sales | 2,568 |
| New Listings | 4,842 |
| Sales to New Listings Ratio | 53% |
| Inventory | 6,740 |
| Months of Supply | 2.62 |
| Benchmark Price | $589,900 |
| Average Price | $649,268 |
| Median Price | $590,250 |
In May 2025, Calgary recorded 2,568 residential sales (–17% Y/Y, yet 11% above its 10-year May average). New listings rose 12% Y/Y, bringing inventory up slightly so months of supply remained near 2.6. Even with balanced conditions, benchmark prices dipped 2% vs. May 2024 to $589,900. Detached and semi-detached benchmarks stayed up Y/Y, but row and apartment prices softened due to increased supply.
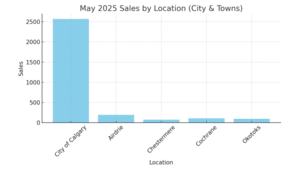 May 2025 Sales by Location (City & Towns)
  May 2025 Benchmark Price by Location (City & Towns)
Towns
| Town | Sales | New Listings | Ratio | Inventory | Months Supply | Benchmark Price |
|---|---|---|---|---|---|---|
| Airdrie | 193 | 334 | 58% | 468 | 2.42 | $540,600 |
| Chestermere | 73 | 157 | 46% | 244 | 3.34 | $715,100 |
| Cochrane | 108 | 293 | 55% | 293 | 2.71 | $589,400 |
| Okotoks | 95 | 135 | 74% | 135 | 1.42 | $633,900 |
Airdrie: May sales (193) are down 10% Y/Y but align with long-term trends. New listings increased, pushing inventory to 468. Balanced conditions remain (58% ratio, 2.42 months supply), though benchmark slipped 2% Y/Y to $540,600 amid rising new-build supply.
Chestermere: 73 sales (–8% Y/Y) and 157 new listings resulted in 244 inventory (3.34 months supply). Limited inventory kept prices strong: benchmark climbed 1.6% Y/Y to $715,100.
Cochrane: 108 sales (–17% Y/Y) versus 293 new listings lifted inventory to 293 (2.71 months supply). Cooler demand-supply balance slowed price growth, but benchmark stands 4% higher Y/Y at $589,400.
Okotoks: 95 sales remain strong despite only 135 new listings. Inventory is tight (1.42 months supply), driving benchmark up 2% Y/Y to $633,900.
Counties & Regions
| Region | Sales | New Listings | Ratio | Inventory | Months Supply | Benchmark Price |
|---|---|---|---|---|---|---|
| Rocky View | 189 | 364 | 52% | 574 | 3.04 | $658,800 |
| Foothills | 172 | 262 | 66% | 316 | 1.84 | $657,400 |
| Mountain View | 55 | 101 | 54% | 165 | 3.00 | $510,500 |
| Kneehill | 15 | 24 | 63% | 35 | 2.33 | $265,800 |
| Wheatland | 40 | 75 | 53% | 138 | 3.45 | $463,800 |
| Willow Creek | 20 | 26 | 77% | 48 | 2.40 | $345,600 |
| Vulcan | 13 | 20 | 65% | 45 | 3.46 | $349,100 |
| Bighorn | 52 | 77 | 68% | 173 | 3.33 | $1,104,500 |
Rocky View: 189 sales and 364 new listings leave 574 inventory (3.04 months supply), with benchmark up 2.1% Y/Y to $658,800.
Foothills: 172 sales versus 262 new listings create a tight 1.84 months supply, pushing benchmark to $657,400 (+2.5% Y/Y).
Mountain View: 55 sales, 101 listings (165 inventory, 3.00 months supply) keep benchmark near $510,500 (flat Y/Y).
Kneehill: 15 sales, 24 listings (35 inventory, 2.33 months supply) hold benchmark around $265,800 (flat).
Wheatland: 40 sales vs 75 listings (138 inventory, 3.45 months supply); benchmark $463,800 (flat Y/Y).
Willow Creek: High 77% sales-to-listings (20 vs 26) and 48 inventory (2.40 months supply) support a benchmark of $345,600 (+1.2% Y/Y).
Vulcan: 13 sales, 20 listings (45 inventory, 3.46 months supply) keep benchmark at $349,100 (flat).
Bighorn: 52 sales, 77 listings (173 inventory, 3.33 months supply) underlie a very high benchmark of $1,104,500 (+2.5% Y/Y).
 May 2025 Sales by Region (Counties)
  May 2025 Benchmark Price by Region (Counties)
© 2025 Diane Richardson. All information herein deemed reliable but not guaranteed.


Comments:
Post Your Comment: